
Sixty-plus years of daily readings at Glen Canyon Dam have produced a small set of numbers that frame everything else about Lake Powell. These are the seven records that matter — the highest, the lowest, and the fastest moves in both directions.
The short answer
Lake Powell’s record book runs from 3,708.34 feet — the July 14, 1983 all-time high, set during a flood that nearly beat Glen Canyon Dam’s spillways — down past 3,519.92 feet, the April 13, 2023 low that stood as the modern record until August 15, 2026, when the lake fell below it. The swing between the 1983 high and the 2023 low is about 188 vertical feet, and the callout above shows how far the reservoir sits from both marks now. The rest of the records describe how the lake moves: a 65-foot climb in one 2023 melt season, a 36-foot year-over-year fall at the depth of the drought, and a 17-year crawl to fill in the first place.
The records at a glance
| # | Record | Figure | Date |
|---|---|---|---|
| 1 | All-time high | 3,708.34 ft | July 14, 1983 |
| 2 | Modern record low | 3,519.92 ft in 2023, broken Aug 15, 2026 (live record in the callout) | April 13, 2023 |
| 3 | Fastest seasonal rise | ~65 ft in 87 days | April–July 2023 |
| 4 | Fastest annual fall | 36 ft peak-to-peak | 2021 → 2022 |
| 5 | Longest climb | 17 years to first fill | 1963–1980 |
| 6 | Last essentially full | 3,698.5 ft (99%) | June 25, 1987 |
| 7 | Driest inflow year | 2.64 MAF (24% of average) | Water year 2002 |
Every current figure — today’s elevation and how far it sits from these marks — lives in the callout above and on the water level chart.
1. The all-time high: 3,708.34 feet, July 14, 1983
The record high came just three years after the lake first filled, and it nearly ended in disaster. A huge, late-melting 1983 snowpack sent floodwater into a reservoir that was already nearly full, and Glen Canyon Dam had to run its spillways for the first time in earnest. High-velocity flow tore chunks out of the spillway tunnels through cavitation, and crews famously bolted plywood flashboards atop the spillway gates to buy storage while repairs raced the inflow (The Colorado Sun).
The lake crested at 3,708.34 feet — roughly 8 feet above full pool — and has never been higher, per the Bureau of Reclamation’s historic record. The full account of that summer is in the 1983 Glen Canyon Dam disaster.
2. The modern low: 3,519.92 feet in 2023, broken in August 2026
Two decades of drought produced the opposite bookend. On April 13, 2023, Lake Powell bottomed out at 3,519.92 feet, at that point its lowest reading since the reservoir first filled. The record held for three years and four months: on August 15, 2026, the daily USBR reading slipped to 3,519.91 feet, and the running record now lives in the callout above and on the water level chart. NASA’s Earth Observatory put storage at about 22% of capacity that month.
The margin below was thin. Minimum power pool — the elevation where Glen Canyon Dam stops generating electricity — sits at 3,490 feet, so the surface came within about 30 feet of shutting the turbines down. The dead pool tracker shows today’s cushion above that line and the harder floor at 3,370 feet.
3. The fastest rise: about 65 feet in one melt season
What the winter of 2022–2023 dumped on the Rockies, spring 2023 delivered downstream. From its April 13 record low, the lake climbed to 3,584.67 feet by July 9, 2023 — a rise of about 65 feet in 87 days, the fastest climb in the reservoir’s modern record. NASA’s satellite series shows the same move as a jump from roughly 22% to 40% of capacity in under three months (NASA Earth Observatory).
One caveat keeps the record honest: it takes a snowpack far above average to move the lake that far, and most melt seasons add much less. How much snowpack raises Lake Powell walks through the conversion math.
4. The fastest fall: 36 feet in a single year
The down-slope record belongs to the depth of the recent crisis. In Reclamation’s monthly record, the lake’s annual high-water mark dropped from about 3,576 feet in 2021 to 3,540 feet in 2022 — a 36-foot fall from one year’s peak to the next, the steepest of the drought era (USBR historic data). The early-2000s drought produced similar slides, including a 34-foot peak-to-peak drop from 2002 to 2003.
The pattern behind those numbers: when inflow collapses, releases to the Lower Basin keep going, and the difference comes straight out of storage. The full year-by-year table is in Lake Powell’s water level history.
5. The longest climb: 17 years to fill
Lake Powell’s slowest record is its first one. Glen Canyon Dam’s diversion gates closed on March 13, 1963, and the Colorado River began backing into Glen Canyon — but mid-1960s drought and the obligation to keep water moving downstream stretched the fill across nearly two decades. The reservoir finally touched its full-pool elevation of 3,700 feet on June 22, 1980, 17 years after closure (U.S. Bureau of Reclamation).
That timescale is worth keeping in mind whenever refilling comes up: even with the 20th century’s wetter hydrology and a nearly empty river to work with, filling this reservoir took 17 years.
6. The last time it was full: June 25, 1987
Reclamation’s 1987 Annual Operating Plan records the cleanest near-full reading in the books: a maximum elevation of 3,698.5 feet on June 25, 1987, logged as 99% full (USBR 1987 AOP, PDF). The lake rose near 3,696 feet once more around July 1999, and that was the end of the full era.
The streak since is its own kind of record — nearly four decades without touching full pool, and the streak keeps growing. Whether it can close is the subject of will Lake Powell fill back up.
7. The driest year: 2002, at 24% of normal inflow
Elevation records trace back to inflow, and the inflow record book has its own floor. In water year 2002, unregulated inflow to Lake Powell totaled just 2.64 million acre-feet — 24% of the 1981–2010 average of 10.83 MAF, the driest year in the reservoir’s record per the Glen Canyon Dam Adaptive Management Program. For scale, the dam’s normal annual release obligation alone runs around 7 to 8.23 MAF.
Years like 2002 are why the elevation records fell through the drought era: a reservoir that must release more than it takes in has only one direction to go. Why is Lake Powell so low covers the structural math.
How to read the full record
Records are the endpoints; the daily series is the story. The water level chart tracks the last 365 days against these record marks, the forecast page shows where Reclamation’s 24-Month Study expects the lake to head, and the live callout at the top of this post carries today’s official reading — re-checked every day. If a new record falls, those pages will show it first.
Sources
- U.S. Bureau of Reclamation — Historic Reservoir Data / Lake Powell (elevation record: 1983 high, annual peaks, 2021–2022 decline)
- U.S. Bureau of Reclamation — Glen Canyon Unit overview (1963 gate closure, first fill on June 22, 1980)
- U.S. Bureau of Reclamation — 1987 Annual Operating Plan (PDF) (3,698.5 ft on June 25, 1987, logged as 99% full)
- NASA Earth Observatory — Lake Powell Rebounds but Drought Remains (April 13, 2023 low; 22% → 40% capacity rebound)
- Glen Canyon Dam Adaptive Management Program — Hydrology (water year 2002 inflow of 2.64 MAF, 24% of average)
- The Colorado Sun — Cavitation and the 1983 spillway crisis at Glen Canyon Dam
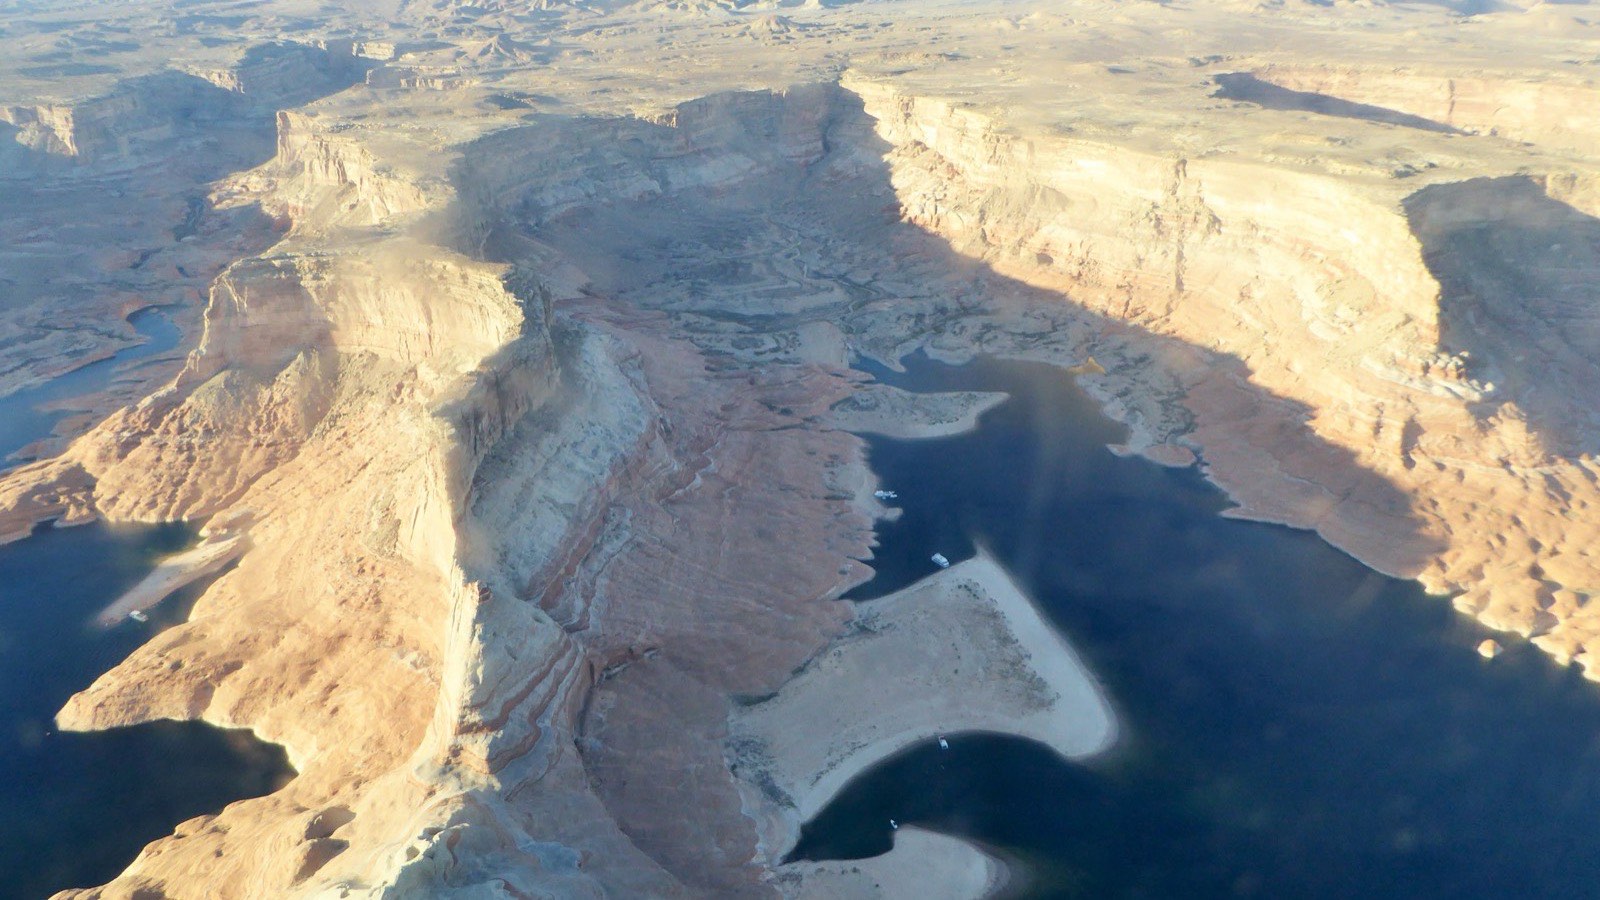
Hero photo: Lake Powell from the air, 2016 by Pierre André Leclercq, licensed CC BY-SA 4.0, via Wikimedia Commons (cropped).

_view_on_the_bathtub_ring_(1).JPG)