
Lake Powell has been filling, spilling, and shrinking behind Glen Canyon Dam for more than sixty years, and its rise and fall mirrors the Colorado River itself — a full reservoir in the 1980s, then a long drought-driven decline that keeps setting new record lows. The dated readings below track the whole run.
The short answer
Lake Powell took 17 years to fill after Glen Canyon Dam was completed in 1963, first touching full pool of 3,700 feet in 1980 and peaking at an all-time high of 3,708.34 feet in July 1983. It stayed high through the 1990s, then the two-decade Colorado River drought pulled it down in a descending staircase: each dry-year trough dropped lower than the last, bottoming at 3,519.92 feet on April 13, 2023, a record the lake broke on August 15, 2026. Wet winters have lifted it partway back several times, but never near full.
Lake Powell’s water level history: the timeline
Every figure below is a fixed, dated elevation reading. Today’s live number is in the callout above.
| Year / date | Elevation | What happened |
|---|---|---|
| March 13, 1963 | filling begins | Glen Canyon Dam’s diversion gates close; Lake Powell starts to fill |
| June 22, 1980 | 3,700 ft | First reached full pool — 17 years after the dam closed |
| July 14, 1983 | 3,708.34 ft | All-time record high; spillways ran during a huge snow year |
| June 25, 1987 | 3,698.5 ft | Last time within ~2 feet of full (about 99%) |
| ~1999 | ~3,700 ft | Rose near full again — the last high before the drought |
| Winter 2005 | ~3,555 ft | First drought trough; then the lowest since filling |
| July 30, 2011 | ~3,661 ft | Wet-year recovery peak |
| Sept 29, 2019 | 3,615.49 ft | Last strong-snowpack rebound before the 2020s crisis |
| Sept 20, 2021 | 3,546.93 ft | Fell below the old 2005 low as the crisis deepened |
| April 13, 2023 | 3,519.92 ft | Modern record low until 2026 — about 188 ft below the 1983 high |
| July 9, 2024 | 3,587.17 ft | 2024 snowmelt peak — a partial recovery off the record |
| July 9, 2025 | 3,559.79 ft | 2025 snowmelt high — below 2024, the slide resumes |
| August 15, 2026 | 3,519.91 ft | Fell below the 2023 low; the running record is on the live chart |
For the interactive daily chart of the most recent year, see the Lake Powell water level chart. The next section gives the high-water mark for every year.
Lake Powell water level by year
Here is Lake Powell’s high-water mark for every year — the highest monthly reservoir reading in each calendar year, from the U.S. Bureau of Reclamation’s historic record for the lake. Read top to bottom, it is the whole arc in one column: a steady 17-year climb, two decades near full, then the drought-era descent.
| Year | Annual high (ft) | Year | Annual high (ft) |
|---|---|---|---|
| 1964 | 3,492 | 1995 | 3,694 |
| 1965 | 3,535 | 1996 | 3,688 |
| 1966 | 3,545 | 1997 | 3,694 |
| 1967 | 3,533 | 1998 | 3,696 |
| 1968 | 3,549 | 1999 | 3,694 |
| 1969 | 3,581 | 2000 | 3,683 |
| 1970 | 3,601 | 2001 | 3,673 |
| 1971 | 3,621 | 2002 | 3,650 |
| 1972 | 3,620 | 2003 | 3,616 |
| 1973 | 3,649 | 2004 | 3,592 |
| 1974 | 3,667 | 2005 | 3,607 |
| 1975 | 3,675 | 2006 | 3,610 |
| 1976 | 3,672 | 2007 | 3,612 |
| 1977 | 3,654 | 2008 | 3,633 |
| 1978 | 3,652 | 2009 | 3,641 |
| 1979 | 3,684 | 2010 | 3,639 |
| 1980 | 3,700 | 2011 | 3,661 |
| 1981 | 3,681 | 2012 | 3,637 |
| 1982 | 3,688 | 2013 | 3,604 |
| 1983 | 3,707 | 2014 | 3,609 |
| 1984 | 3,702 | 2015 | 3,614 |
| 1985 | 3,700 | 2016 | 3,620 |
| 1986 | 3,700 | 2017 | 3,635 |
| 1987 | 3,698 | 2018 | 3,623 |
| 1988 | 3,693 | 2019 | 3,622 |
| 1989 | 3,678 | 2020 | 3,611 |
| 1990 | 3,656 | 2021 | 3,576 |
| 1991 | 3,639 | 2022 | 3,540 |
| 1992 | 3,634 | 2023 | 3,583 |
| 1993 | 3,668 | 2024 | 3,586 |
| 1994 | 3,666 | — | — |
Figures are the highest monthly USBR reading in each year, rounded to the foot — the finest daily peaks run a touch higher, which is why 1983’s daily record of 3,708.34 feet sits just above its 3,707-foot monthly high. For 2025 and today’s reading, see the callout above and the water level chart; a few dated readings elsewhere in this post (like the September 2019 satellite reading of 3,615.49 feet) fall below the year’s July peak because they were taken after the melt crest.
The fill years: 1963–1980
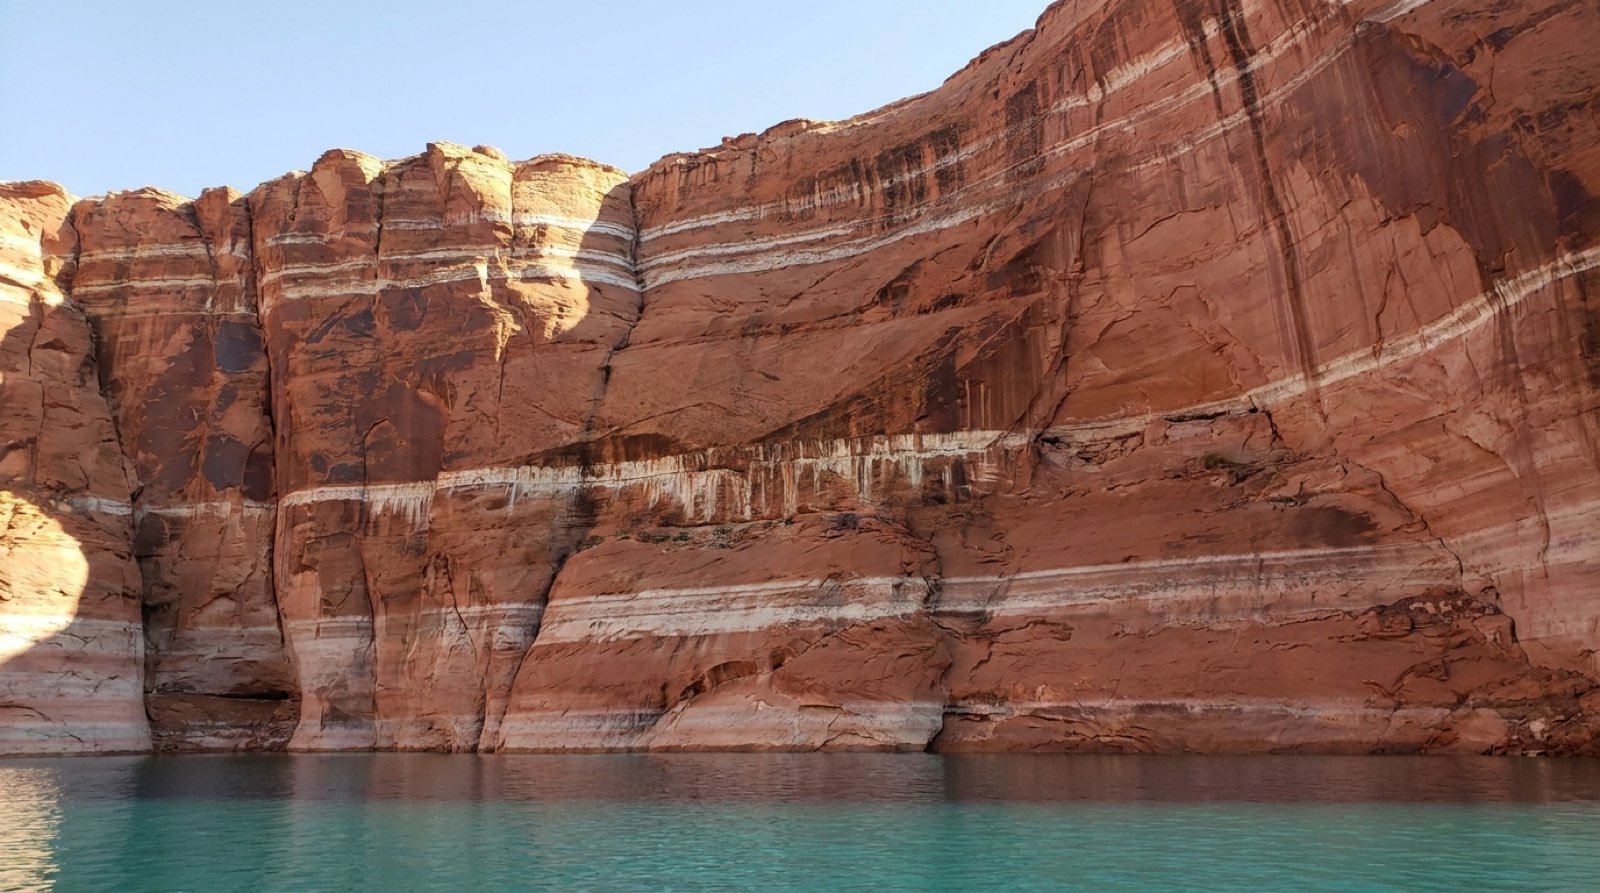
Lake Powell did not exist before Glen Canyon Dam. When the dam’s diversion gates closed on March 13, 1963, the Colorado River began backing up into the red sandstone canyons of the Utah–Arizona border, and the reservoir filled slowly over the next 17 years. Drought in the mid-1960s and the need to keep water flowing downstream stretched the process out. The lake finally reached its full-pool elevation of 3,700 feet on June 22, 1980, according to the U.S. Bureau of Reclamation.
The high-water era: 1980s–1990s
The reservoir spent its first two full decades near the top. Just three years after filling, an enormous 1983 snowpack sent so much water into Lake Powell that Glen Canyon Dam had to run its spillways, and the lake crested at 3,708.34 feet on July 14, 1983 — about 8 feet over full pool and the highest it has ever been. It came within a couple feet of full again on June 25, 1987, at 3,698.5 feet, and rose back near 3,700 feet as late as 1999. Through this stretch, Lake Powell behaved as designed: a large, mostly full Upper Basin savings account.
The long decline: 2000–2025
Then the water stopped coming. Beginning around 2000, the Colorado River basin entered what scientists now call a megadrought, and Lake Powell has not risen above its 50-year annual average of about 3,639 feet since 2002 (Western Resource Advocates). The decline came in steps rather than one smooth slide — dry stretches pulled the lake down, and occasional wet years pushed it partway back up:
- Winter 2005 — the first deep trough. The lake fell to roughly 3,555 feet, its lowest since filling at the time (Grand Canyon Trust).
- 2011 — a wet Rockies winter lifted Powell to a recovery peak near 3,661 feet by late July (NASA Earth Observatory).
- 2019 — a strong snow year brought the last real rebound, to 3,615.49 feet on September 29 (NASA Earth Observatory) — already about 90 feet under the 1983 high.
- 2021 — the slide resumed hard. By September 20, 2021, the lake was down to 3,546.93 feet (NASA Earth Observatory), below the old 2005 low, and Reclamation began emergency releases from upstream reservoirs to prop it up.
- April 13, 2023 — Lake Powell hit 3,519.92 feet, then the modern record low, only about 30 feet above the minimum power pool where Glen Canyon Dam’s turbines stop.
- 2024–2025 — a strong 2023 snowpack and a decent 2024 lifted the lake to a snowmelt high near 3,587 feet on July 9, 2024, but the weaker 2025 melt topped out lower, near 3,560 feet in July 2025. The staircase held: a recovery, then a lower peak.
- August 15, 2026 — after a water year with inflow near a third of average, the lake slipped below the 2023 low to 3,519.91 feet; by September 3 the daily reading stood at 3,517.79 feet (USBR daily data on the water level chart).
The pattern is the through-line of the whole record: each drought trough (2005, 2021, 2023, 2026) sat lower than the one before, and no year since 2011 has re-crested its 3,661-foot high — the rebounds of 2019, 2024, and 2025 each fell further short. For why the water stopped coming, see why Lake Powell is so low; for a closer look at the 2023 bottom, see how low is Lake Powell.
The sawtooth: why the lake rises and falls every year
Underneath the long decline, Lake Powell moves on an annual rhythm. Rocky Mountain snowmelt pours in from roughly April through July and raises the lake; through late summer, fall, and winter, releases through Glen Canyon Dam exceed the trickle of inflow and the level drops. That is the sawtooth you see on any multi-year chart. A big snow year stretches the up-stroke — the 2023 snowpack raised Powell about 65 feet off its record low in a single season — while a dry winter barely dents the down-stroke. The long-term direction is just the sum of those years: more dry ones than wet ones since 2000.
Where the history points next
Sixty years of readings show a reservoir that can still rise sharply in a good year, but from a base that keeps ratcheting lower. Refilling Lake Powell to anything like its 1980s levels would take several consecutive well-above-average winters, which no current forecast projects. The honest read is a lake that swings within a lower and lower band, not one climbing back to full.
None of that is a firm prediction — a strong winter would rewrite the near term, the way 2023 did. For where the level is actually headed, see the forecast page and will Lake Powell fill back up; for how much cushion is left below the record, see the dead pool tracker. The live callout above and the water level chart track the newest readings as this history keeps being written.
Sources
- U.S. Bureau of Reclamation — Glen Canyon Unit / Lake Powell overview (first fill to 3,700 ft on June 22, 1980; storage and design)
- U.S. Bureau of Reclamation — Glen Canyon Dam / Lake Powell operations (water year releases and current operations)
- U.S. Bureau of Reclamation — Historic Reservoir Data / Lake Powell (year-by-year monthly elevation record — source for the annual high-water-mark table above)
- NASA Earth Observatory — World of Change: Water Level in Lake Powell (1999 near-full and the drought-era decline; dated 2011/2019/2021 readings linked inline above)
- Grand Canyon Trust — Lake Powell Levels, 1963–2025 (year-by-year elevation record, including the 1983 high, 2005 trough, and 2023 low)
- Western Resource Advocates — The Story of Lake Powell (50-year average of ~3,639 ft; not exceeded since 2002)
- NOAA Colorado Basin River Forecast Center — Colorado River inflow forecasts