
Every snow report out of the Rockies raises the same question about Lake Powell, and the answer runs through a chain of conversions where each link leaks. The arithmetic below is sourced at every step.
The short answer
Snowpack raises Lake Powell in three steps: snow water equivalent (SWE) melts into runoff, runoff becomes unregulated inflow, and inflow raises the water surface at roughly 57,600 acre-feet per vertical foot near current elevations. That last number is the one most people never see, and it is the reason big snow headlines so often end in small elevation gains. The conversion is lossy at every step, and 2026 showed how lossy it can get.
What a vertical foot of Lake Powell costs
A foot of elevation is not a fixed amount of water. Lake Powell sits in a canyon that widens as it fills, so each additional foot spreads across more surface area and costs more water than the one below it. Reclamation’s 2017 area and capacity tables give the exact shape.
| Elevation | Surface area | Water needed to rise 1 ft |
|---|---|---|
| 3,370 ft (dead pool) | 18,826 acres | ~18,800 acre-feet |
| 3,490 ft (minimum power pool) | 45,725 acres | ~45,700 acre-feet |
| 3,525 ft | 57,552 acres | ~57,600 acre-feet |
| 3,700 ft (full pool) | 158,234 acres | ~158,200 acre-feet |
The two right-hand columns match because they measure the same thing. An acre-foot is one acre covered one foot deep, so the surface area in acres is the acre-feet required to raise the lake a foot. The table’s own capacity figures confirm it: storage rises from 6,973,521 acre-feet at 3,520 feet to 7,549,095 at 3,530 feet, which works out to 57,557 acre-feet per foot across that band.
Reclamation has stated the same relationship in plain language from the other direction. In February 2026, after the water year inflow forecast fell to roughly 3.0 million acre-feet (MAF) below November’s projection, the agency wrote that “that loss is equivalent to approximately 50 feet in elevation in Lake Powell.” That implies about 60,000 acre-feet per foot, within a few percent of the table.
The chain from snow to feet
Nothing measures snowpack’s effect on the reservoir directly. The link runs through three agencies:
- NRCS SNOTEL sites across the Upper Colorado Basin measure snow water equivalent, the depth of water held in the snow if you melted it where it lies.
- NOAA’s Colorado Basin River Forecast Center turns those SWE readings, plus soil moisture and temperature, into an April–July unregulated inflow forecast for Lake Powell.
- Reclamation feeds that inflow forecast into its 24-Month Study, converting volume into projected elevation with the area-capacity tables above.
Losses compound down that chain. Snow sublimates. Meltwater soaks into dry soil before it ever reaches a stream. Some of what reaches the reservoir gets released downstream rather than stored. Snowpack sets the ceiling on a year’s gain; it doesn’t set the gain.
Why 2026’s 60% snowpack delivered 17% runoff
2026 is the cleanest illustration of the leak the basin has ever produced, and the numbers are worth reading slowly.
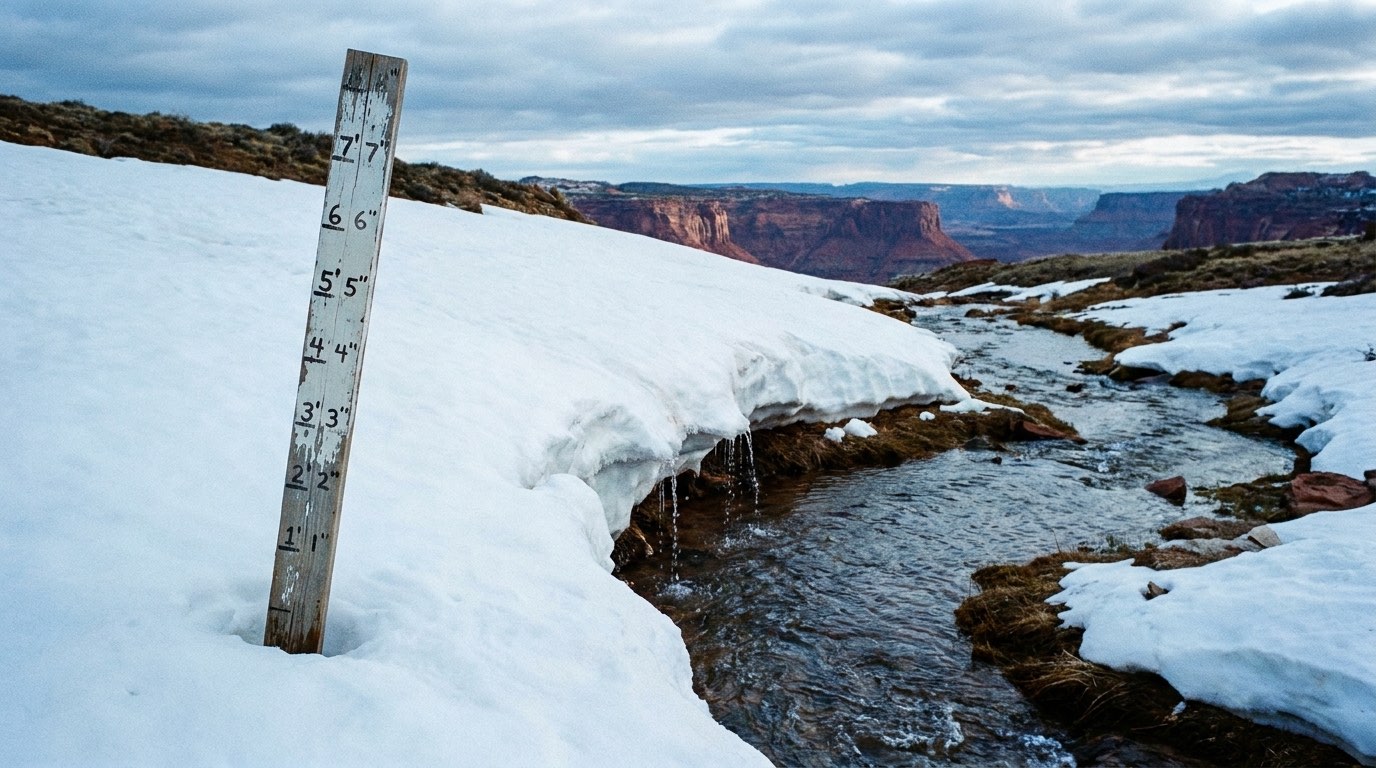
Snow accumulation above Lake Powell peaked on March 9, 2026 at 8.9 inches of SWE, 60% of the 30-year median peak of 14.8 inches, per the Central Arizona Project’s basin dashboard built on NRCS data. A 60% snowpack is bad. It is not catastrophic on its own.
What followed was. That peak arrived nearly a month early, and Colorado went on to set record-low April 1 SWE values since SNOTEL monitoring began in the 1980s, according to NOAA’s NIDIS drought update. Snow that melts in a warm March runs into soils parched by two decades of drought, and those soils take their cut first. By April, the forecast unregulated inflow into Lake Powell was 22% of average. It kept falling. Reclamation’s weekly hydrologic update put the final April–July 2026 forecast at 1.08 MAF, roughly 17% of normal.
So: 60% of median snowpack, 17% of normal runoff. The gap between those two numbers is the story of the modern Colorado River. Tree-ring work by Williams and colleagues in Nature Climate Change found 2000–2021 was the driest 22-year stretch in the Southwest in roughly 1,200 years, with warming a substantial driver. Hotter air and thirstier soil mean an average snow year no longer buys an average runoff year. That’s the mechanism behind why Lake Powell is so low.
The releases nobody accounts for
Even a stored acre-foot isn’t a kept acre-foot. Glen Canyon Dam releases water downstream to Lake Mead all year, and in dry years those releases can exceed what flows in.
For water year 2026, Reclamation scheduled a 6.0 MAF release under the Mid-Elevation Release Tier, the lowest its current rules allow, per its Glen Canyon operations page. Set that against a forecast water year inflow near 3.5 MAF (36% of normal) and the direction is arithmetic, not opinion. More going out than coming in draws the reservoir down, regardless of what fell as snow. It’s why the lake can take in a spring’s worth of melt and still finish the year lower, and why Reclamation’s February study projected Powell reaching minimum power pool by December 2026 and 3,476 feet by March 2027, which would be the lowest elevation on record since the reservoir filled. Those are scenarios, not certainties, and a wet winter would redraw them.
The one place the math cuts in the lake’s favor
There’s a strange consolation in that table. Because a foot near today’s elevation costs about 57,600 acre-feet while a foot near full pool costs about 158,200, water buys almost three times more elevation at a low lake than at a high one.
The same million acre-feet that would lift a nearly full Powell about 6 feet lifts it roughly 17 feet at current levels. This is why a single strong snow year can move the needle so visibly when the reservoir is low: the 2023 snowpack raised Powell about 65 feet off its April 2023 low of 3,519.92 feet. A low reservoir is cheap to raise and cheap to drain, in equal measure. It also means the distance to dead pool shrinks faster in acre-feet than the elevation numbers suggest.
What it would take to hold the lake, let alone refill it, is a longer question, and the honest read of the forecast is covered in will Lake Powell fill back up? For where the snowmelt comes from in the first place, see where Lake Powell gets its water. We track the trend daily on the forecast page and the 365-day water level chart.
Sources
- U.S. Bureau of Reclamation — Lake Powell 2017 Area and Capacity Tables, Technical Memorandum ENV-2021-98 (surface area and capacity by elevation, NGVD29)
- U.S. Bureau of Reclamation — “Spring Runoff Projections for Colorado River Basin Worsen”, Feb 13, 2026 (the ~50 feet per 3.0 MAF statement; Dec 2026 and Mar 2027 projections)
- U.S. Bureau of Reclamation — Glen Canyon Dam Water Operations (water year 2026 inflow forecast and 6.0 MAF release)
- U.S. Bureau of Reclamation — Weekly Hydrologic Update (April–July 2026 inflow forecast, 17% of normal)
- Central Arizona Project — Colorado River Conditions Dashboard (2026 peak snow accumulation, 60% of median)
- NOAA / NIDIS — Snow Drought Conditions and Impacts in the West, Apr 9, 2026 (record-low April 1 SWE; 22% inflow forecast)
- NRCS — SNOTEL Upper Colorado River Basin snow and precipitation reports
- Williams, Cook & Smerdon, “Rapid intensification of the emerging southwestern North American megadrought,” Nature Climate Change (2022)