
Lake Powell, the reservoir behind Glen Canyon Dam on the Arizona–Utah border, is one of the most-watched water bodies in the American West. For two decades the headline has been the same: the water keeps dropping. Two forces drive it, and both are measurable, as is what would have to change to turn it around.
The short answer
Lake Powell is low for two reinforcing reasons. First, the Colorado River basin has been gripped by the driest 20-plus-year stretch in roughly 1,200 years, so far less water flows in than the 20th-century average. Second, the river is over-allocated: the basin has long promised and used more water than the river reliably delivers. Less supply meeting steady demand drains a reservoir, and that is exactly what the record shows.
Lake Powell by the numbers
A handful of fixed elevations frame every conversation about the lake. These are engineered or historic marks, not today’s reading, which lives in the callout above.
| Elevation | What it is |
|---|---|
| 3,708.34 ft | All-time high, July 14, 1983 |
| 3,700 ft | Full pool — maximum storage, about 24.3 MAF |
| 3,519.92 ft | 2023 low (April 13, 2023); modern record until August 15, 2026 |
| 3,490 ft | Minimum power pool — hydropower stops |
| 3,370 ft | Dead pool — no gravity release through the dam |
| 3,132 ft | The original Colorado River channel at the dam |
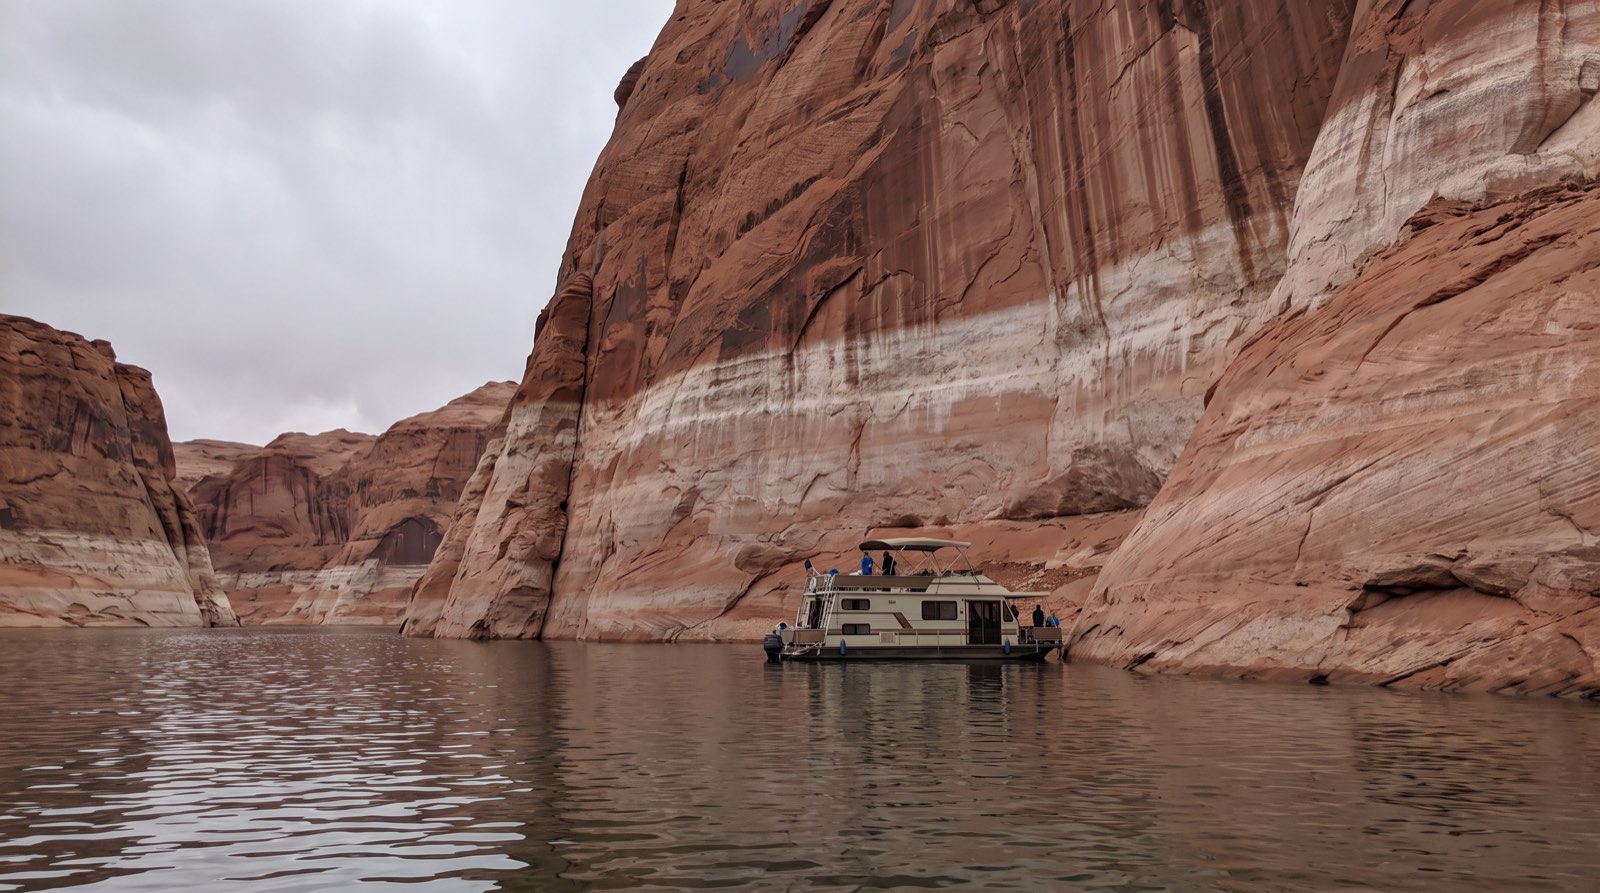
The reservoir has swung about 188 vertical feet between its 1983 peak and its 2023 low. For the full 365-day series and how today’s level compares to those record marks, see how low is Lake Powell and the water level chart.
Why the reservoir dropped: three forces
The decline is not a mystery. Three forces, each measurable, have pulled Lake Powell down since 2000.
The driest stretch in 1,200 years
Tree-ring reconstructions published in Nature Climate Change (Williams et al., 2022) found that 2000–2021 was the driest 22-year period in the Southwest in about 1,200 years, and that human-caused warming made it substantially worse. Hotter air pulls more moisture from soil and snow, so even an average snow year now yields below-average runoff into the reservoir.
The effect shows up directly in the inflow. Per the Bureau of Reclamation’s Glen Canyon Dam Adaptive Management Program, unregulated inflow to Lake Powell averaged just 8.62 MAF a year from 2000 to 2020 — about 80% of the 1981–2010 average of 10.83 MAF — and ran above average in only 4 years of that stretch. The driest years were brutal: 2.64 MAF in 2002 (24% of average) and 4.6 MAF in 2018 (43%).
The Colorado River is over-allocated
The 1922 Colorado River Compact divided the river’s water assuming an annual flow that later proved optimistic. Roughly 40 million people and millions of acres of farmland now depend on the river. Independent analyses of basin water use put the structural deficit — the gap between what the system consumes and what the river reliably provides — on the order of 1.2 to 1.5 MAF a year. When the paper promises exceed the water in the channel, reservoirs like Powell and Lake Mead absorb the shortfall and shrink.
Steady releases to the Lower Basin
Glen Canyon Dam doesn’t only hold water; it releases it downstream to meet Upper Basin delivery obligations and to generate power. In dry years those releases can exceed what flows in, drawing the reservoir down further. Reclamation has been throttling them hard: the water year 2026 release was cut to 6.0 MAF, the lowest its current rules allow, specifically to keep more water in Powell.
The 2026 picture
2026 has been one of the worst water years on record for the lake. The Colorado Basin River Forecast Center pegged water year 2026 unregulated inflow at about 3.27 MAF, roughly 34% of average (USBR, May 2026). On August 15, 2026 the lake fell below the 2023 low of 3,519.92 feet, and Reclamation’s August 2026 24-Month Study projects it below 3,510 feet during water year 2027 (USBR).
To slow the decline, Reclamation is releasing between 660,000 and 1 million acre-feet from Flaming Gorge Reservoir upstream through April 2027. None of these figures are certainties; a strong winter would change the picture, the way the 2023 snowpack did. For where levels are actually headed, see how low is Lake Powell, whether Lake Powell is drying up, and the forecast page.
What’s being done about it
Reclamation isn’t watching passively. Under the Drought Response Operations Agreement it’s releasing water from Flaming Gorge and other upstream reservoirs to prop Powell up, and it cut Glen Canyon’s own 2026 release to the legal minimum to hold elevation.
The deeper fix is contested. The rules governing how Powell and Mead share shortage expire at the end of 2026, and the seven basin states haven’t agreed on what replaces them. Some advocates, including the Glen Canyon Institute, argue for a “Fill Mead First” approach that would consolidate storage in one reservoir instead of splitting it between two half-empty ones. For the worst-case mechanics and the tools used to avoid them, see what dead pool means.
Lake Powell vs. Lake Mead
Powell and Mead are the two giants of the Colorado River system, and they rise and fall together. The evergreen basics:
| Lake Powell | Lake Mead | |
|---|---|---|
| Dam | Glen Canyon (completed 1963) | Hoover (completed 1936) |
| Full-pool elevation | 3,700 ft | 1,229 ft |
| Capacity at full pool | ~24.3 MAF | ~26 MAF |
| Basin role | Upper Basin “savings account” | Lower Basin delivery hub |
For a live, side-by-side look at how full each reservoir is today, see Lake Powell vs. Lake Mead.
How close is it to dead pool?
Two elevations matter most on the way down:
- Minimum power pool — 3,490 feet. Below this, Glen Canyon Dam can no longer reliably generate hydroelectricity for the roughly 5 million customers its plant serves across seven Western states.
- Dead pool — 3,370 feet. Below this, water can no longer pass through the dam’s outlets by gravity at all.
The dead pool tracker shows exactly how many feet of cushion remain today, and what dead pool means walks the full ladder of thresholds. The reservoir has never reached either line, but the 2022–2023 scare pushed the water within about 30 feet of the power-pool mark.
Will Lake Powell come back?
Both rising and falling, on a schedule. Lake Powell almost always rises in late spring and early summer as mountain snowpack melts, then falls through late summer, fall, and winter as releases continue and inflow drops. A single strong snow year can add dozens of feet: the exceptional 2023 snowpack lifted Powell roughly 65 feet off its April 2023 low.
Whether those gains hold depends on the next winter, and on the long-term math of a warming basin that keeps taking flow off the top. That’s the subject of Will Lake Powell fill back up? For today’s direction, watch the live callout above and the forecast page.
Sources
- Williams, Cook & Smerdon, “Rapid intensification of the emerging southwestern North American megadrought,” Nature Climate Change (2022)
- U.S. Bureau of Reclamation — Glen Canyon Dam / Lake Powell operations (record low, water year 2026 inflow and 6.0 MAF release)
- U.S. Bureau of Reclamation — Glen Canyon Dam Adaptive Management Program, Hydrology (2000–2020 inflow averages)
- U.S. Bureau of Reclamation — Flaming Gorge drought-response operations (upstream releases to Lake Powell)
- NOAA Colorado Basin River Forecast Center — Colorado River inflow forecasts
- National Park Service — Glen Canyon NRA, Changing Lake Levels