
Lake Powell goes up almost every spring. That single fact powers a lot of confusing headlines, because a reservoir can gain elevation for six weeks and still finish the year lower than it started. In 2026 it did exactly that.
The short answer
Lake Powell rises for a few weeks each spring, when Rocky Mountain snowmelt arrives faster than Glen Canyon Dam lets water out, and falls the rest of the year. In 2026 that spring rise came to roughly 2 feet. It was small enough that the normal summer drawdown carried the reservoir straight through its 2023 record low on August 15, 2026, at 3,519.91 feet (PBS NewsHour).
Powell’s normal rhythm: up in spring, down the rest of the year
Snow in the Colorado, Utah, and Wyoming Rockies is where most of Lake Powell’s water starts. It melts through spring, drains into the Colorado, Green, and San Juan rivers, and reaches the reservoir mostly between April and July. Glen Canyon Dam releases water year-round on a schedule Reclamation sets each October, so the lake climbs only while inflow beats that release.
That window is short. Outside it, the release keeps running and the lake goes down, which is why a reservoir can post a rising month and a falling year at the same time. Why Lake Powell is so low covers the longer decline underneath the annual sawtooth.
How big is a melt season, really?
Reclamation publishes Lake Powell’s elevation every day. Measuring each year from its spring trough to the highest reading that follows gives the actual size of seven melt seasons (Reclamation RISE, daily observed elevation):
| Year | Spring low | Melt-season peak | Rise |
|---|---|---|---|
| 2020 | 3,599.26 ft (May 2) | 3,611.02 ft (Jun 22) | 11.76 ft |
| 2021 | 3,559.89 ft (May 25) | 3,561.78 ft (Jun 14) | 1.89 ft |
| 2022 | 3,522.24 ft (Apr 22) | 3,539.84 ft (Jul 3) | 17.60 ft |
| 2023 | 3,519.92 ft (Apr 13) | 3,584.68 ft (Jul 8) | 64.76 ft |
| 2024 | 3,558.21 ft (Apr 16) | 3,587.17 ft (Jul 9–10) | 28.96 ft |
| 2025 | 3,557.85 ft (May 1) | 3,561.89 ft (Jun 18) | 4.04 ft |
| 2026 | 3,525.95 ft (May 7) | 3,527.97 ft (Jun 1) | 2.02 ft |
A melt season in this reservoir can mean 65 feet or it can mean 2, and the answer swings on one winter’s snow. 2026 produced the second-smallest rise of the seven, ahead of 2021 by about a tenth of a foot. Going back through the same daily record to 2000, only three springs moved the lake less: 2002, when it slipped slightly instead of rising, then 2021 and 2012.
The 2026 peak landed on June 1, earlier than any other year in the table, and it topped out only about 8 feet above the 2023 record low, which the lake went on to break almost 11 weeks later. NASA’s satellite record of the 2023 rebound shows that year’s lake moving from about 22% to 40% of capacity in under three months (NASA Earth Observatory). Nothing close to that happened in 2026.
Why the 2026 rise was so small
Three measurements from the water year explain most of it, each from a primary source.
- Snowpack was thin, and it peaked early. Basin-wide snow water equivalent peaked on March 9, 2026 at 60% of the median peak, close to a month ahead of the normal peak accumulation date (Reclamation draft 2027 AOP). The Central Arizona Project’s dashboard puts that peak at 8.9 inches against a 30-year median of 14.8 (CAP).
- Inflow came in near the bottom of the record. Observed April through July unregulated inflow to Lake Powell totaled 1,143 thousand acre-feet, 18% of normal, with the full water year forecast at 3,516 kaf, 37% of normal (Reclamation weekly hydrologic update, inflow figures as of September 1, 2026 — PDF). July on its own ran 84 kaf, 9% of average (Reclamation).
- Releases kept running. Glen Canyon Dam sent 6.0 million acre-feet downstream in water year 2026, cut from a scheduled 7.48 maf under the Mid-Elevation Release Tier and still far above what came in (Reclamation).
The snowpack measured 60% of its median peak, but April–July inflow came in at 18% of normal, so a large share of the shortfall opened up between the mountains and the reservoir. Runoff efficiency, the fraction of snowmelt that reaches the river, drops when dry soils absorb the melt first, and a warm early melt gives them more time to do it. A basin delivering that little while the dam releases 6.0 maf drains its reservoir, spring melt included. How much snowpack raises Lake Powell walks through the conversion from snow water equivalent to feet of elevation.
Reclamation puts the long run in context too: 2000 through 2022 is the lowest 23-year stretch since Glen Canyon Dam began filling in 1963, averaging 8.29 maf of unregulated inflow against a 1991–2020 average of 9.60 maf.
How to tell whether it’s rising today
The callout above carries the current elevation and the 30-day change, both from Reclamation’s daily readings. A positive 30-day number in May usually means the melt is running. The same number in September would be unusual, and typically traces to a monsoon storm rather than snowmelt.
For anything longer than a month, the water level chart plots the last 365 days, where the spring bump and the summer slide sit on one line. Reading a single day in isolation is how people conclude the lake is recovering during a year it lost ground.
Will it rise again in 2027?
Some rise is likely, because some snow falls in the Rockies most winters. How much is genuinely unknown in September, since the snowpack that drives it has not accumulated yet.
Reclamation’s August 2026 forecast brackets the range: water year 2027 unregulated inflow between a dry-case 3.60 maf (37% of average) and a wet-case 14.30 maf (149%), with 7.30 maf (76%) as the median. Under that median case, Reclamation projects Lake Powell’s elevation declining below 3,510 feet during water year 2027, and has placed the reservoir in the Low Elevation Infrastructure Protection Range with a planned water year 2027 release of 6.00 to 7.00 maf (Reclamation).
So a strong winter could produce a real spring rise and still leave the lake below where it sat a year earlier. The thresholds that matter are minimum power pool at 3,490 feet and dead pool at 3,370 feet, both tracked live on the dead pool page; the forecast page carries the current trend and the latest 24-Month Study numbers. Will Lake Powell fill back up takes the longer view.
Sources
- U.S. Bureau of Reclamation — Glen Canyon Dam water operations (current status, 24-Month Study projections, inflow forecasts, release volumes)
- Reclamation RISE — Lake Powell daily elevation (the observed readings behind the melt-season table)
- Reclamation — draft 2027 Annual Operating Plan (2026 snowpack peak timing)
- Reclamation — weekly hydrology report (observed April–July 2026 inflow)
- Central Arizona Project — Colorado River Conditions Dashboard (2026 basin snowpack peak)
- NASA Earth Observatory — Lake Powell Rebounds, but Drought Remains (2023 runoff season)
- PBS NewsHour — Lake Powell hits record low (August 2026 record)
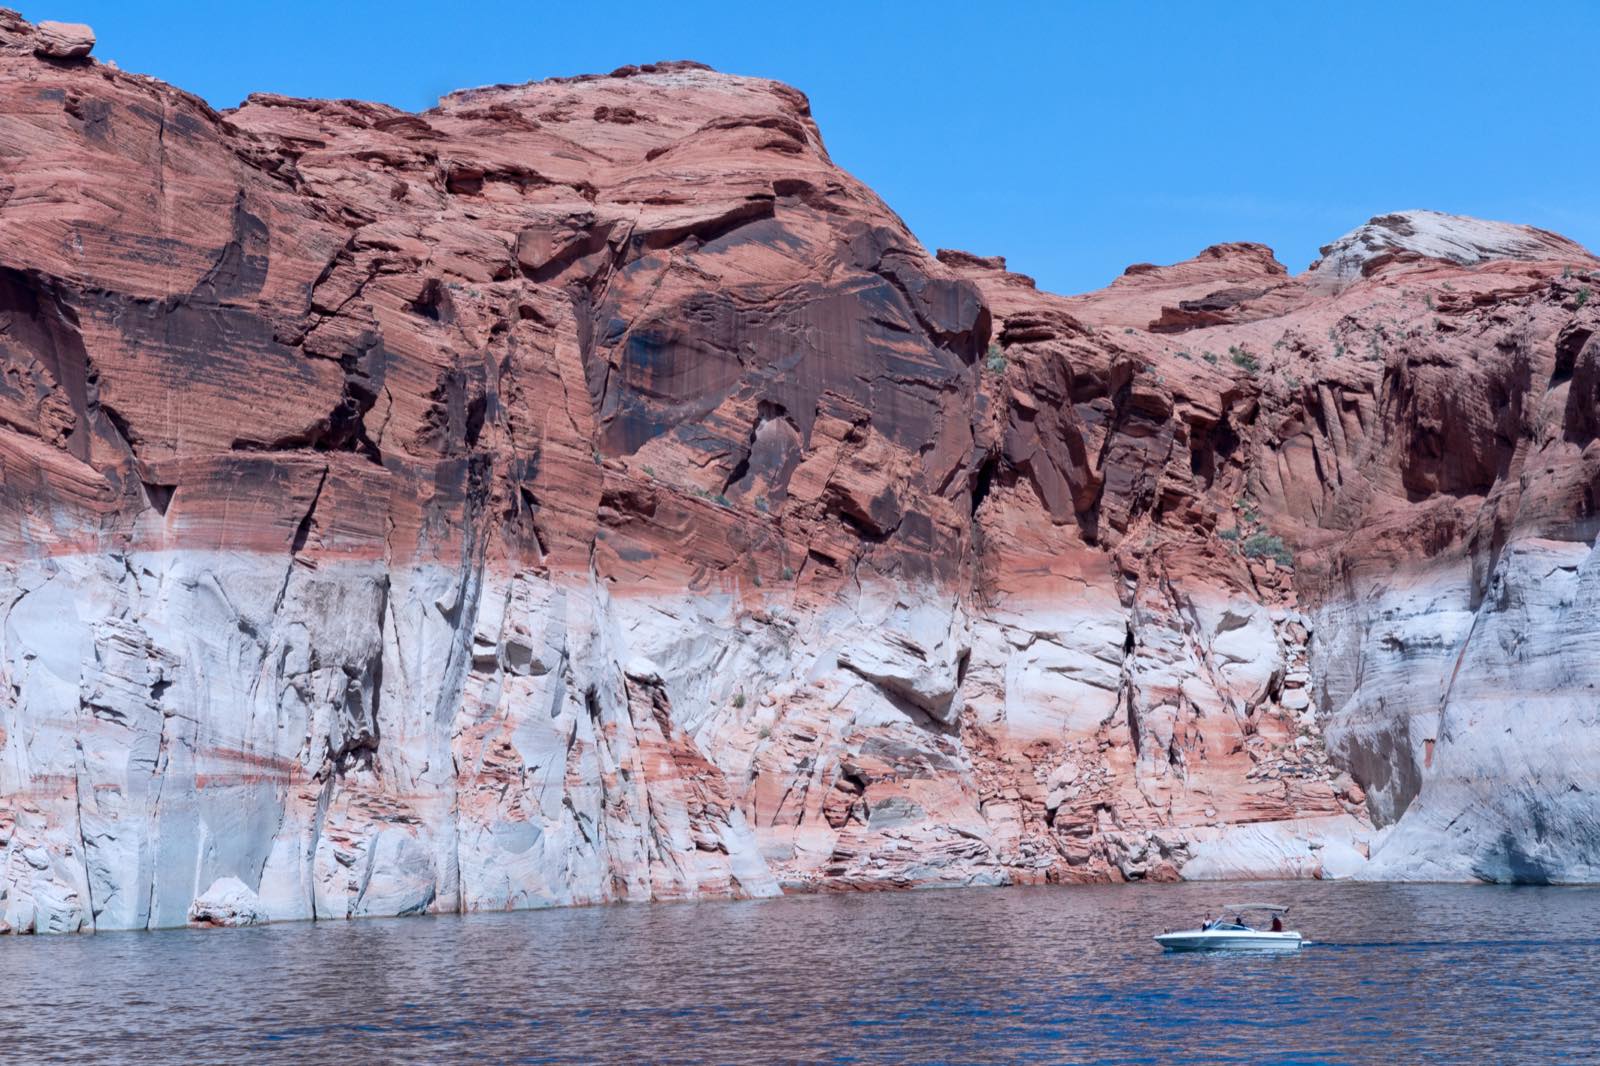
Hero photo: Lac Powell - Marque de la baignoire by Jean-Christophe BENOIST, licensed CC BY 3.0, via Wikimedia Commons (resized). It was taken in 2010; the white band has grown taller since.