
Lake Powell’s water data is free and public, but it’s spread across four federal agencies, two datums, and a handful of independent sites that don’t always agree.
The short answer
The official Lake Powell water level is the U.S. Bureau of Reclamation’s daily elevation reading, published free on its hydrodata pages and in its RISE data catalog. Everything else on the list below either measures the lake more often (USGS), forecasts it (NOAA and Reclamation’s 24-Month Study), or tracks the snow that will fill it (NRCS). If two sources disagree by about 3 feet, they’re almost certainly using different datums.
Lake Powell data sources at a glance
| Source | What you get | How often | Best for |
|---|---|---|---|
| Reclamation hydrodata | Elevation, storage, inflow, release | Daily | The official number |
| Reclamation RISE | The same daily series plus unregulated inflow, evaporation, surface area | Daily | History and downloads |
| USGS gauge 09379900 | Elevation in both NGVD29 and NAVD88 | Every 15 minutes | Watching a fast rise hour by hour |
| Reclamation 24-Month Study | Projected elevation and releases, most, min, and max probable | Monthly | Where the lake is headed |
| NOAA CBRFC | April–July and water-year inflow forecasts | Through the forecast season | Spring runoff outlook |
| NRCS snowpack | Upper Colorado snow water equivalent against the median | Daily | Winter, before the melt |
Which Lake Powell number is official?
Reclamation’s. The agency runs Glen Canyon Dam and records one daily elevation for the reservoir, along with storage in acre-feet, inflow, and release in cubic feet per second. Its RISE catalog lists the elevation series as “typically updated once a day” and keeps it alongside separate series for unregulated inflow, evaporation, bank storage, and surface area (Reclamation RISE). The daily elevation record runs back to December 1963, the year the dam began storing water.
USGS defers to it. Its gauge at the dam, station 09379900, has logged elevation every 15 minutes since April 18, 2019, and the station page reads: “Please refer to the Bureau of Reclamation for official lake elevation data” (USGS). The 15-minute feed earns its place during a fast change, like the fall 2026 storm runoff covered in Is Lake Powell rising?.
We check the Reclamation feed every day to build this site. It posts at no fixed hour, and the newest reading often lags over weekends, so a Friday number showing on a Sunday is usually normal.
Why Lake Powell numbers don’t match from site to site
Three things cause almost every disagreement.
- Datum. Reclamation reports Lake Powell in the National Geodetic Vertical Datum of 1929 (NGVD29). Its 2017 capacity survey states that NGVD29 is 2.913 feet lower than the newer North American Vertical Datum of 1988 (NAVD88) at the reservoir (Reclamation 2017 area and capacity tables). The USGS gauge publishes both, so on any given day its NAVD88 reading sits about 2.9 feet above its NGVD29 reading for the same water (USGS). A tracker quoting the NAVD88 figure is accurate in its own datum, but it won’t match Reclamation, the thresholds (full pool 3,700 ft, minimum power pool 3,490 ft, dead pool 3,370 ft), or this site.
- Timing. Reclamation’s daily value is one instantaneous reading. A 15-minute gauge, or a daily average built from it, can differ by a few tenths of a foot on a day the lake is moving.
- Revisions. Reclamation labels its hydrodata “provisional and subject to revision” (Reclamation hydrodata). Recent days can shift slightly once the agency finalizes them.
Forecasts and snowpack: the forward-looking data
The 24-Month Study is Reclamation’s monthly projection of where Lake Powell and the other system reservoirs are headed. The agency updates its model at the start of each month once the National Weather Service’s Colorado Basin River Forecast Center (CBRFC) delivers its inflow forecast, and publishes most, minimum, and maximum probable runs (Reclamation). The forecast page carries the latest of those numbers next to the live trend.
CBRFC’s forecasts extend three to seven months depending on the season (Reclamation), and its April–July outlook for Lake Powell inflow (forecast point GLDA3) is the number to watch from January through spring. Upstream of that, the NRCS snowpack chart for the Upper Colorado Region shows how this winter’s snow compares to the median (Reclamation, Glen Canyon Dam operations, which links both). How much snowpack raises Lake Powell explains how to turn a snowpack percentage into feet of elevation.
Independent sites that repackage the data
Several non-government sites pull from these feeds and present them in one place.
- Lake Powell Water Database is an independent site that shows Reclamation’s daily readings in a table with elevation change, storage, inflow, and outflow, along with the latest USGS gauge value and links to snowpack charts and webcams.
- Central Arizona Project’s Colorado River Conditions Dashboard covers the whole system, including combined storage and basin snowpack, from the perspective of a Lower Basin water supplier.
Both are useful. When a number looks off, trace it back to Reclamation or USGS and check the datum.
The easy way to follow it
This site does the tracing for you. The callout above shows Reclamation’s latest reading, the water level chart keeps the last 365 days with a page for each day, and the dead pool page shows the live distance to the thresholds that matter.
To follow it on your phone, the free Lake Powell Water Level app for iPhone carries the same Reclamation reading, trend charts out to a year, inflow against dam releases, snowpack against the median, and launch status for all 13 boat ramps. It also sends a push alert when the lake moves, at a sensitivity you pick: any move, 0.25 ft, 0.5 ft, or 1 ft.
Sources
- U.S. Bureau of Reclamation — Lake Powell hydrodata (daily elevation, storage, inflow, release)
- Reclamation RISE — Lake Powell daily elevation, item 508 (update frequency, related series)
- Reclamation — Lake Powell 2017 area and capacity tables (NGVD29 vs NAVD88 offset)
- USGS — Lake Powell at Glen Canyon Dam, 09379900 (15-minute elevation, both datums)
- Reclamation — 24-Month Study (monthly projections and update schedule)
- Reclamation — Glen Canyon Dam water operations (links to CBRFC and NRCS forecasts)
- NOAA Colorado Basin River Forecast Center — Lake Powell inflow forecast
- NRCS — Upper Colorado Region snowpack
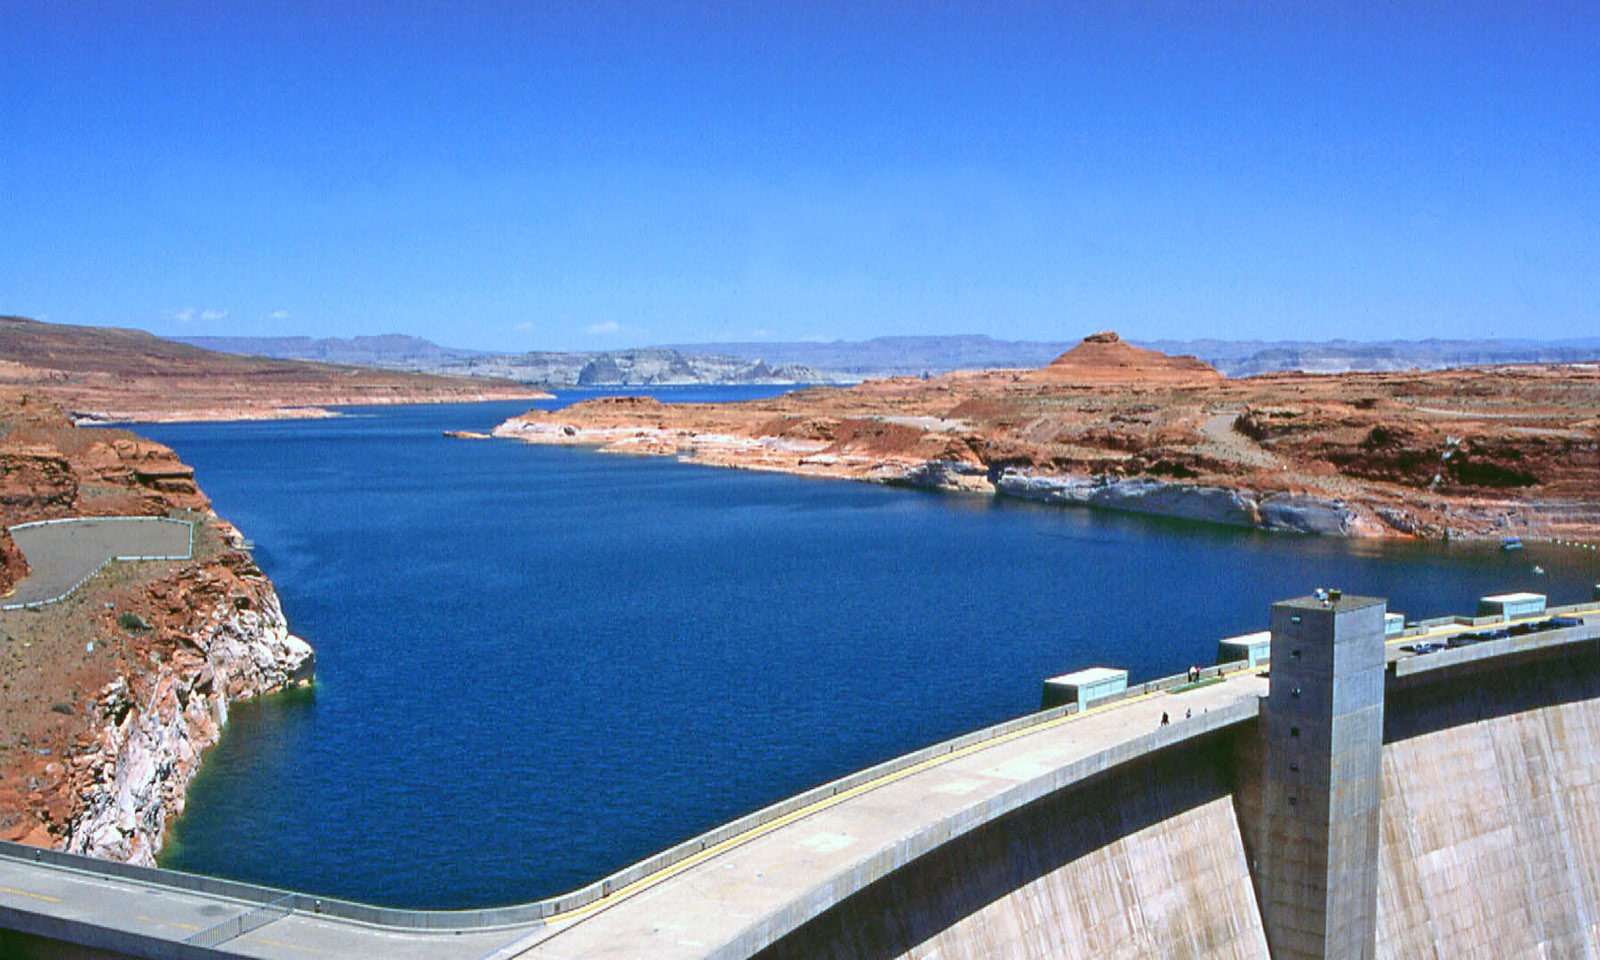
Hero photo: Lake Powell Reservoir and Glen Canyon Dam, Arizona by W. Bulach, licensed CC BY-SA 4.0, via Wikimedia Commons (resized). It was taken in 1995, when the lake stood far higher than it does today.