
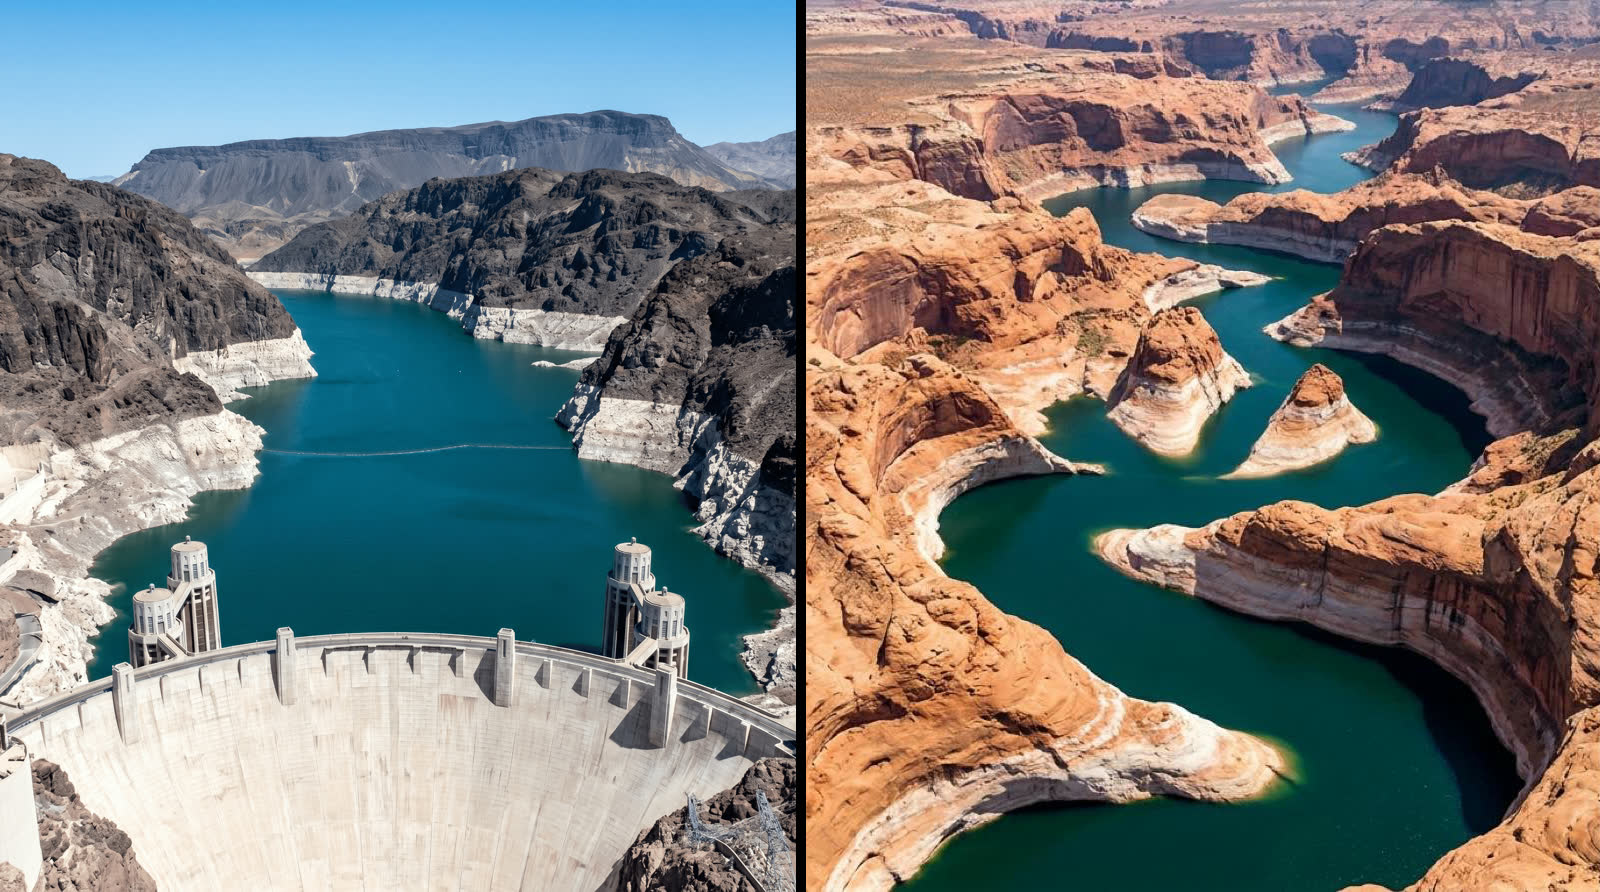
Lake Powell and Lake Mead are the two largest reservoirs in the United States, and both have been draining for two decades. Which one is worse off flips depending on what you measure, and the answer is not the obvious one.
The short answer
Both reservoirs are in serious trouble, in different ways. Lake Powell, behind Glen Canyon Dam, sits closer to losing hydropower — a narrow band of elevation separates the point where its turbines stop from the point where water can no longer pass the dam at all. Lake Mead, behind Hoover Dam, is closer to dead pool as a share of its range, and its failure would sever water to about 40 million people across the Lower Basin and Mexico. The sharper question is which one breaks first, and what breaks.
There is also a genuine surprise in the numbers. Despite sitting upstream and filling first from Rocky Mountain snowmelt, Lake Powell has recently held less water than downstream Lake Mead. That inversion is a product of the rules that move water between the two lakes.
The two lakes, by the thresholds that matter
The evergreen size comparison — capacity, shoreline, which is technically bigger — lives on the live Lake Powell vs. Lake Mead page. What matters for “which is in worse shape” is how far each lake is from the elevations where something stops working.
| Lake Powell | Lake Mead | |
|---|---|---|
| Dam | Glen Canyon (1963) | Hoover (1935) |
| Position | Upstream — Upper Basin | Downstream — Lower Basin |
| Full pool | 3,700 ft | 1,229 ft |
| Minimum power pool | 3,490 ft | ~950 ft (after turbine upgrades) |
| Dead pool | 3,370 ft | 895 ft |
| Modern record low | Reset Aug 15, 2026 (prior: 3,519.92 ft, Apr 13, 2023) | ~1,040 ft (Jul 2022) |
| First thing to fail on the way down | Hydropower at Glen Canyon Dam | Water deliveries to ~40M people |
For where each lake sits against these marks today, see the live side-by-side comparison and the dead pool tracker.
The counterintuitive part: the downstream lake has more water
On February 1, 2026, Lake Mead held about 2,714,000 acre-feet more water than Lake Powell — the largest gap between the two since April 2022, according to the Center for Colorado River Studies at Utah State University. Over the four months before that, combined storage in the two reservoirs barely moved, yet Powell lost about 615,000 acre-feet while Mead gained the same amount.
Water shifted from the upper bucket to the lower one, even though both were near empty. Powell drained into Mead.
Why Lake Powell drains into Lake Mead
The reservoirs run on two different clocks. Lake Powell’s annual release is set months in advance in Reclamation’s operating plan and has little room to change during the year. Lake Mead’s releases flex month to month, rising and falling with Lower Basin water demand. When that demand drops — from mandatory shortage cuts, paid conservation, and autumn rain — Hoover Dam sends less water downstream, so more of what arrives from Powell simply stays in Mead.
That is layered on top of a deliberate policy to protect Powell’s elevation. The standard release from Glen Canyon Dam under the 2007 operating guidelines is 8.23 million acre-feet a year. Reclamation cut that to 7.0 MAF in 2022–2023 and then to 6.0 MAF for water year 2026 — the lowest its rules allow (U.S. Bureau of Reclamation). It has also propped Powell up with emergency releases from upstream reservoirs like Flaming Gorge under the Drought Response Operations Agreement. Both moves keep water in Powell — but the water that does get released still lands in Mead.
Which lake is closer to a breaking point?
Two different failures wait at the bottom, and each lake is nearer to a different one.
Lake Powell’s cliff is hydropower. Glen Canyon Dam stops generating electricity at minimum power pool — 3,490 feet — and only about 120 feet of elevation separate that from dead pool at 3,370 feet, where water can no longer pass through the dam by gravity. At its April 2023 low of 3,519.92 feet, Powell sat only about 30 feet above the power-pool line, and it fell below that mark again in August 2026. That is a thin margin, and it is why so much of the drought response is aimed at holding Powell up. You can see how many feet of cushion remain today on the dead pool tracker and read the full threshold ladder in what dead pool means.
Lake Mead’s cliff is delivery. Hoover Dam supplies drinking and irrigation water to Arizona, Nevada, California, and Mexico. Dead pool at 895 feet would stop those deliveries, and during its July 2022 record low near 1,040 feet, Mead had already traversed more than half of its usable range. Turbine upgrades let Hoover keep making some power down toward roughly 950 feet, but the delivery risk is the one that would ripple through cities and farms.
So the honest read is split. On hydropower and dam-operations risk, Lake Powell is more precarious. On water-supply consequence and proximity to dead pool as a share of its range, Lake Mead carries the heavier stakes. Both have fallen past the midpoint between full and empty, and both depend on active management to avoid crisis. For the drivers behind Powell’s side of that decline, see why Lake Powell is so low.
What could change the answer
The relationship between the two lakes is a policy choice as much as a weather outcome, and that policy is about to change.
- A big snow year. Powell rises fast on strong runoff; the 2023 snowpack lifted it roughly 65 feet off its record low. A wet winter narrows the gap in a single season. The forecast page tracks the current trend and the 24-Month Study outlook.
- The 2026 rules cliff. The 2007 Interim Guidelines that govern how Powell and Mead share shortage expire at the end of 2026. The seven basin states are negotiating what replaces them, with Upper Basin states pushing to protect Powell and Lower Basin states pushing to protect Mead. Whichever way that lands will reshape who drains and who holds.
- The “Fill Mead First” debate. Some advocates argue for consolidating storage in one reservoir rather than splitting it between two half-empty ones. It remains a proposal, not policy, but it captures the core tension: two giant lakes, and not enough water to keep both healthy.
None of that makes a firm prediction possible. A strong winter would ease both lakes; another dry year would tighten both margins. For which direction Powell is trending right now, watch the live callout above and the water level chart.
Sources
- U.S. Bureau of Reclamation — Glen Canyon Dam / Lake Powell operations (release volumes, water year 2026 cut to 6.0 MAF, thresholds)
- U.S. Bureau of Reclamation — Hoover Dam & Lake Mead FAQs (Lake Mead full-pool elevation 1,229 ft and reservoir capacity); Reclamation Lower Colorado operations for the 895 ft dead pool and Hoover power-pool elevations
- U.S. Bureau of Reclamation — Flaming Gorge drought-response operations (emergency releases to prop up Lake Powell)
- Center for Colorado River Studies, Utah State University — “Lake Powell and Lake Mead are moving in opposite directions” (Feb 2026; the 2.7 MAF storage gap and its mechanism)
- U.S. Geological Survey — Lake Powell 2017–2018 bathymetric resurvey, SIR 2022-5017 (capacity and sedimentation)
- NOAA Colorado Basin River Forecast Center — Colorado River inflow forecasts